Mapping cancer’s cellular landscape: researchers uncover spatial interactions and genetic subclones in tumor microenvironments across six cancer types.
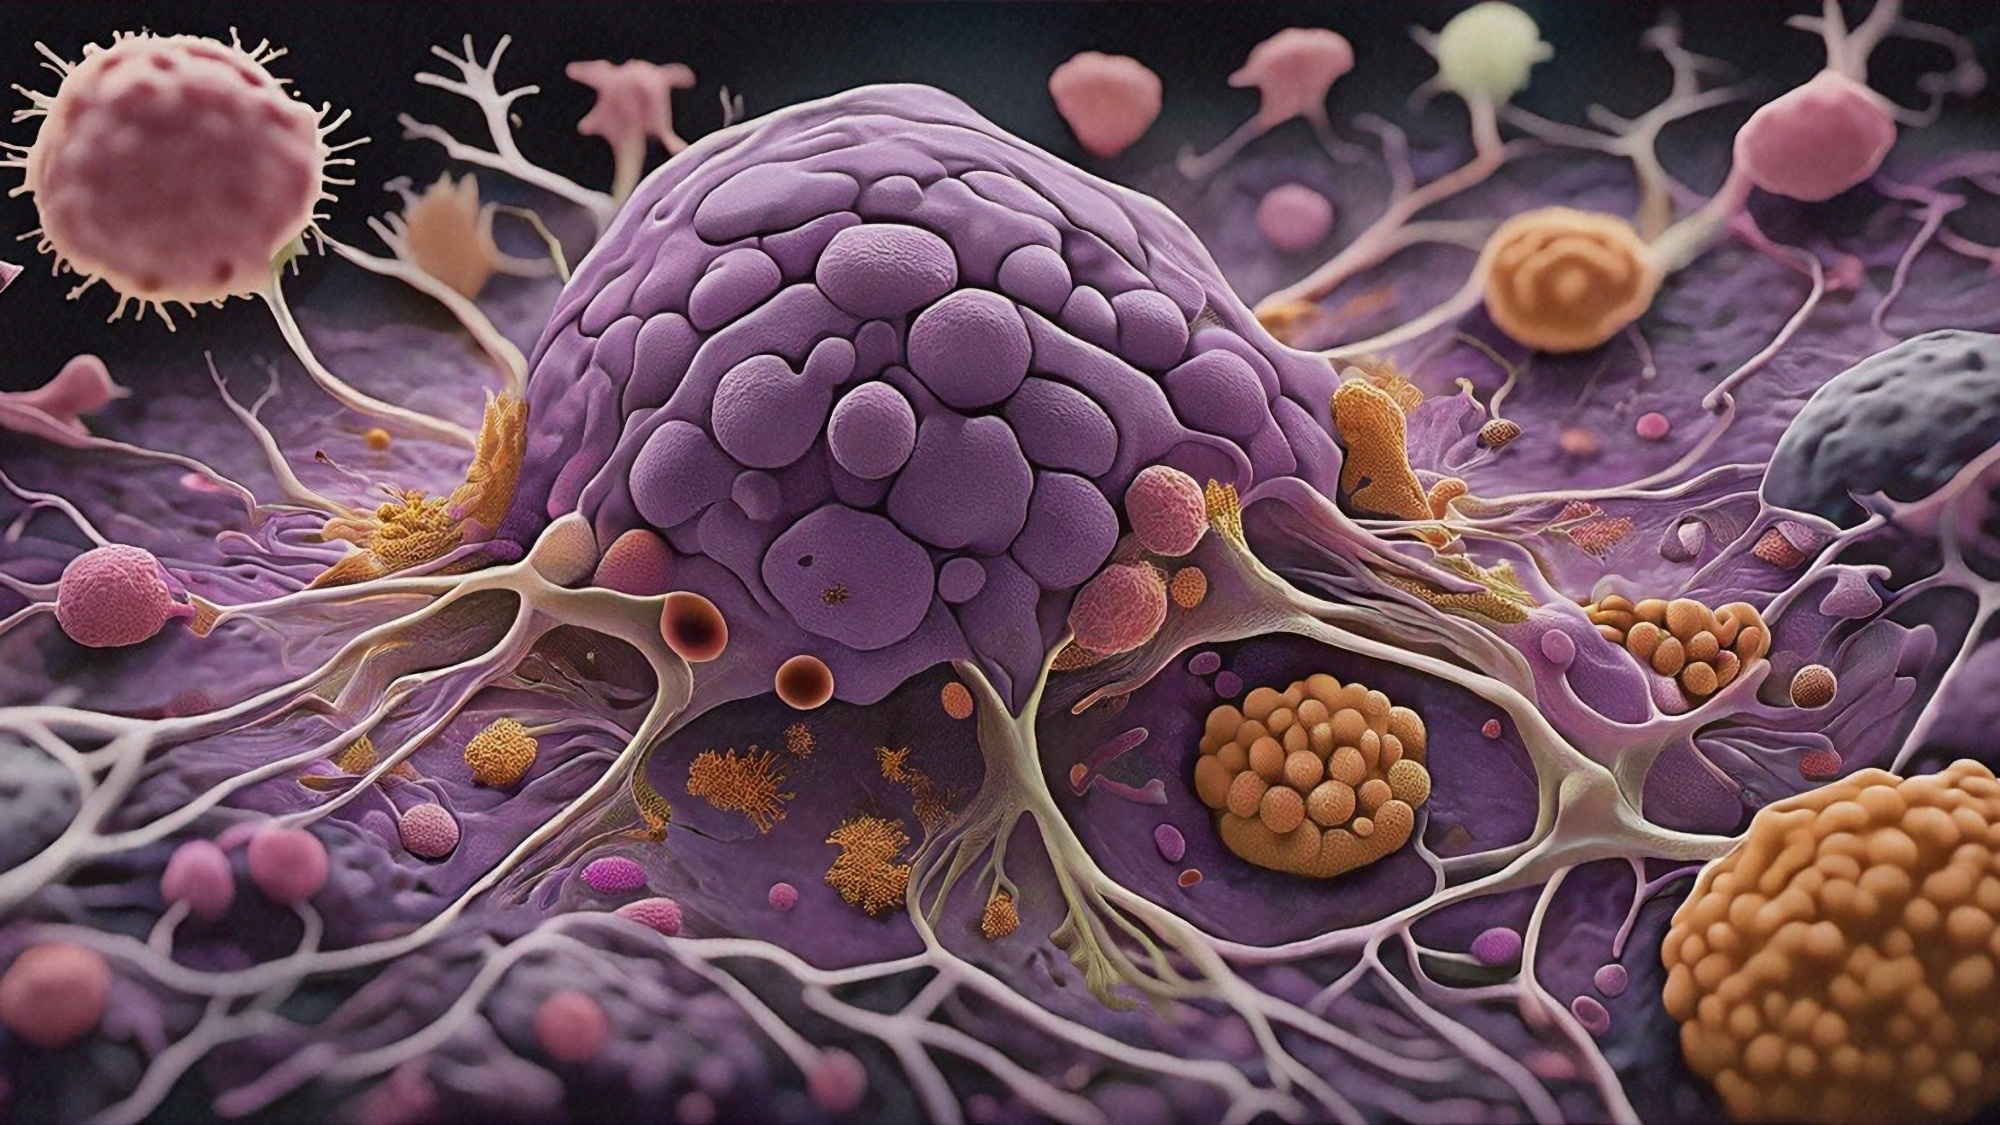
Study: Tumour evolution and microenvironment interactions in 2D and 3D space. Image Credit: Shutterstock AI / Shutterstock.com
In a recent study published in Nature, researchers investigate the spatial organization of cancer cells and the tumor microenvironment by analyzing over one hundred tumor sections across six types of cancers. Tumor microregions were mapped to reveal distinct cellular interactions, metabolic and immune activities, and spatial subclones.
Studying cancer and the tumor microenvironment
Cancers often become resistant to treatment due to genetic subclones and interactions with the tumor microenvironment, which are difficult to identify using traditional single-cell and bulk sequencing methods.
However, spatial transcriptomics allows these dynamics to be studied in extensive detail. Likewise, advanced techniques such as co-detection by indexing (CODEX) imaging, which involves highly multiplexed imaging, can localize and identify cell interactions and reveal clonal structures within tumors.
Clonal evolution, which is the genetic adaptation of cancer cells to treatment and environmental pressures, remains a key challenge in oncology. Nevertheless, recent technological advances have allowed scientists to investigate these adaptations more precisely and explore immune and stromal interactions within the tumor microenvironment.
About the study
In the current study, researchers examined 131 tumor samples from six types of cancers, focusing on spatially distinct tumor microregions. These regions were identified and categorized using hematoxylin and eosin staining, as well as transcriptional profiling techniques.
Samples were split into two groups, with one group comprising 50 samples with spatially distinct tumor regions, whereas the other included 82 samples with diffuse regions. Fifteen additional samples were selected for three-dimensional (3D) reconstructions to analyze structural complexities.
Tumor regions were classified by size into small, medium, and large categories based on spot counts and depths from tumor boundaries. To explore genetic variations within the tumor microregions, copy number variations and spatial subclones were identified using various tools such as whole-exome sequencing. This method also allowed the researchers to detect up to three distinct subclones for each sample section.
Gene expression profiling was also performed to analyze transcription diversity within cancer cells. Any unique pathways identified in the samples were also noted, as they could potentially be influenced by genetics and the tumor microenvironment.
Non-tumor cell infiltration in boundary areas was mapped using single-nucleus ribonucleic acid (RNA) sequencing. Subclonal differences in the infiltration patterns were analyzed, in addition to spatial layer analysis performed from the tumor core to the tumor microenvironment.
CODEX imaging was used to confirm the distribution of immune cells and differences in gene expression at the tumor boundary. CODEX, along with spatial transcriptomics, was used to generate three-dimensional (3D) reconstructions and analyze complex growth patterns and connectivity. Deep learning methods were then employed to identify cellular regions and track gene expression in 3D.
Study findings
A total of 131 samples from six cancer types including breast cancer, colorectal carcinoma, pancreatic ductal adenocarcinoma, renal cell carcinoma, uterine corpus endometrial carcinoma, and cholangiocarcinoma were analyzed in the current study.
Tumor microregions within these samples were identified as distinct cancer cell clusters separated by stromal areas and characterized by size. Colorectal carcinoma exhibited larger tumor microregions as compared to breast and pancreatic cancer tumors.
Metastatic tumors were often deeper and larger than primary tumors, thus indicating unique growth settings during metastasis. Furthermore, the proportion of small microregions was higher in primary tumors than metastatic tumors at 66.3% and 40.2%, respectively.
The analysis of copy number variations identified spatial subclones for 125 of the 131 tumor sections, with most samples containing one to three subclones. Cancer types were also associated with variability in their subclones, with colorectal carcinoma and breast cancer exhibiting distinct subclonal structures that were suggestive of common ancestry.
Significant heterogeneity was observed in transcriptional signatures, particularly in pancreatic ductal adenocarcinoma. Comparatively, breast cancer, colorectal carcinoma, and renal cell carcinoma exhibited moderate variability.
The gene set enrichment analysis identified shared oncogenic pathways, such as those linked to the proto-oncogene MYC and early region 2 binding factor (E2F), across the tumor microregions. However, some pathways, such as the unfolded protein response in breast cancer metastatic samples, were unique to specific tumor microregions. Thus, although genetic alterations largely drive the transcriptional profiles, local tumor microenvironmental factors are also involved.
Conclusions
The study findings highlight the complexity of the tumor microenvironment and emphasize the importance of profiling spatial subclones to understand tumor behavior and treatment responses. Differences in drug sensitivity among the tumor subclones could significantly impact therapeutic strategies.
Journal reference:
- Mo, C. K., Liu, J., Chen, S., et al. (2024). Tumour evolution and microenvironment interactions in 2D and 3D space. Nature. doi:10.1038/s41586-024-08087-4
Source link : News-Medica

